NDVI computation on the Unity cluster.
Objective: Make a timeseries plot of NDVI for Rhode Island.
- Request cpus from unity and set up a Python environment that will use that processors.
- Modify the landsat_explore.py script to implement the NDVI calculation.
- Use the Unity cluster to split this calculation amongst the processors and peform the computation for all the satellite images in your items list. (Refer back to your coreclock.py solution).
- Observe whether there is are detectable differences in the NDVI for the RI/New England region over time.
REMINDER: This exercise uses cumulative concepts from throughout the course, list and numpy arrays, creation of modules, reading and writing files, using Pandas dataframes, and unix commands. Refer to your code from previous weeks and to the online library documentation as needed.
Use the documentation to supplement this guide https://docs.unity.uri.edu/documentation/.
Step 1: Modify landsat_explore.py code to carry out NDVI computation.
The Normalized Difference Vegetation Index can be computed directly from two frequency bands in the Landsat satellite data - the Near Infrared band (NIR) and the visible red (Red) spectral reflectance:
$$ NDVI = \frac{NIR - Red}{NIR + Red} $$
NOTE: The .tif files ending in _B4.tif contain the near-infrared (NIR) spectral wavelengths, and the .tif files ending in _B3.tif contain the Red spectral reflectance.
NOTES:
A compilation of Landsat ETM files for the Rhode Island region can be found in
/work/pi_csc593_uri_edu/Landsaton the Unity HPC.Put all the code of the script inside the
ifstatement below. This ensures that the cluster resource request will be compiled at runtime before the computations begin:
if __name__ == '__main__':
A list of scenes (filenames) from the files ending in _B4.tif. This can be found in the text file called test.out, in the same folder
/work/pi_csc593_uri_edu/Landsat.Define a module to compute the NDVI with the following operations. Your module should take a single element of the list of satellite filenames or
scenesand it should return the average NDVI value from that item.
# Get the path+filename for the NIR band.  Do the same for the Red band.

# Use the skimage.io library to open and read the NIR band geotiff image. Do the same for the Red band.

# Compute the NDVI as (nir-red)/(nir+red).  Note that zeros at some cells in the .tif will cause inf
# or undefined values.  Use np.divide(), np.subtract(), and np.add() in order to tolerate
# the undefined values.

# Replace all undefined values with NaNs.

denom = np.where(denom==0,np.nan,denom) # Sub NaNs anywhere in the denominator equals zero.
NDVI = np.where(NDVI == np.inf, np.nan, NDVI)


# OPTIONAL: Dask has a function for parallelizing array computations, it's called .compute()
# Import the array library from dask
import dask.array as da

# You can use da.nanmean() to compute and return the average NDVI value from this satellite item.
av_ndvi = da.nanmean(NDVI).compute()
Add the code block from coreclock.py that uses f = client.map() to distribute the computation amongst the cores and displays the progress. f = client.map() will take your module name and the satellite items list as inputs.
When the parallel processing is done, extract the list of Average NVDI computations from your module using client.gather().
AvNDVI_list = client.gather(f)
Save the data for plotting a timeseries on your computer, or do the plotting on the HPC and download the image.
Step 2: Download and post-process your results.
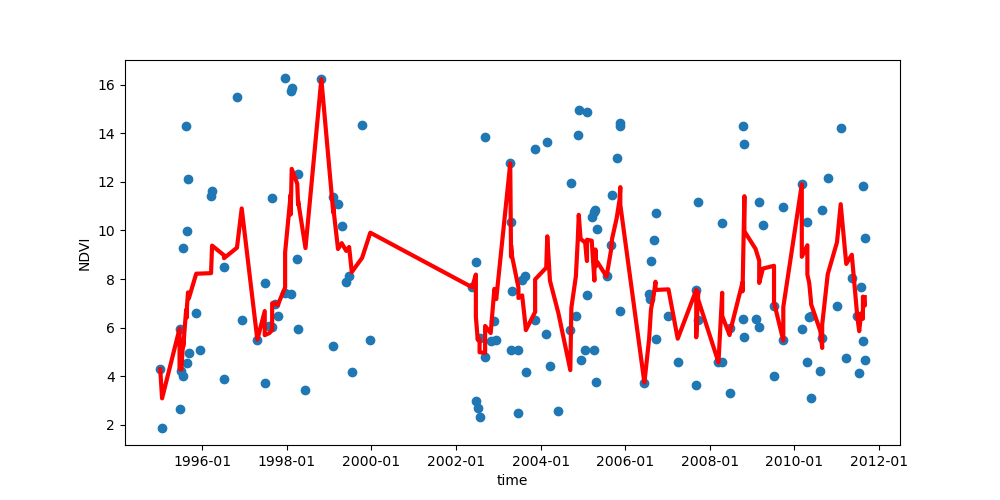
- Make a plot of the NDVI index with time, similar to the one below.
- You can improve the rendering of dates on the y-axis using the mdates formatter:
import matplotlib.dates as mdates
# read in .csv..
#
# Use pandas to create a running or 'rolling' mean of the timeseries. Create a running average and include in the graph. Explain the averaging interval you chose.
# f, ax = plt.subplots(figsize=(10,5))
#
#Display only year and month on x-axis.
ax.xaxis.set_major_formatter(mdates.DateFormatter('%Y-%m'))
Summary of results:
Results: Report on your results.
- How many satellite scenes did you include? What span of time do they represent?
- How long did the analysis take to complete?
- What resources did you request?
- What trends, if any, can you discern in the data and in the running average?
Caveats:
- What other factors might be influencing the results, which might make it harder to achieve a clear interpretation?
Step 3: What to turn in?
- Modify this .ipynb to include your results from the NDVI calculation and summary comments.
- The python script you used to make the NDVI calculation.
- Answers to the questions above.